ABSTRACT
The use of Dissolved Gas Analysis (DGA) as a method for determining the types of pending or occurring faults within power transformers has been in practice for many years. It has been proven that the generation of certain gases within a transformer is an excellent indicator that a failure is pending. DGA techniques have become so sensitive and accurate at measuring these gases that the entire scheme has become standard practice as part of the normal maintenance for many electric power utility companies.
Despite how effective DGA techniques have become, the proper use and interpretation of gas level results (i.e., ppm levels) is still not fully understood by many utility people. Therefore, it is the intent of this paper to provide common knowledge and understanding of all the tools, methods, and techniques available for non-chemical engineers within typical utility companies. We will fully describe each of the available interpretation techniques as well as provide a comparison of the accuracy and reliability of each diagnostic method based on one independent case study.
Introduction
Reliable energy flow is essential for all major electric utility companies, making power transformers one of their most important assets and largest investments. In addition, the transformer fleets in several parts of the world are operating beyond their design lives, with higher-than-average loads. For these reasons, transformer condition assessment and failure analysis is a high priority.
Over time, electrical and thermal stresses on a transformer’s insulating materials (arcing, corona discharge, sparking, and overheating) can result in incipient transformer faults. As these stresses accumulate, the insulating materials will breakdown and release several different gases. These gases can be detected in transformer insulating oil using sensitive and reliable Dissolved Gas Analysis (DGA) techniques for determining the type of pending or occurring fault.
DGA is considered the best method for determining a transformer’s overall condition and is now a universal practice. Advantages of DGA include:
- Advanced warning of developing faults
- Status checks on new and repaired units
- Convenient scheduling of repairs
- Monitoring of units under potential overload conditions.
The use of appropriate DGA diagnostic methods can provide improved service reliability, avoidance of transformer failure, and deferred capital expenditures for new transformer assets. To ensure success, we will discuss the tools available for DGA and how to properly interpret the results.
Formation of Gases in Transformer Oil
Thermal and electrical stresses that occur within normal operating transformers generate hydrocarbon gases which can indicate potential problems within the transformer. Some gas generation is expected as transformers age, so it is important to separate normal gassing rates from excessive gassing rates. Since normal gas generation varies with transformer design, loading, and the type of insulating material used, general gassing rates are used for all transformers to define abnormal behavior.
Typical gases that appear in transformers are hydrogen (H2), methane (CH4), ethane (C2H6), ethylene (C2H4), and acetylene (C2H2). These gases begin to form at specific temperatures and dissolve within the insulation oil of a power transformer, as shown in Figure 1. The types and quantities of the gases that form will depend on the nature and intensity of the fault.
Figure 1
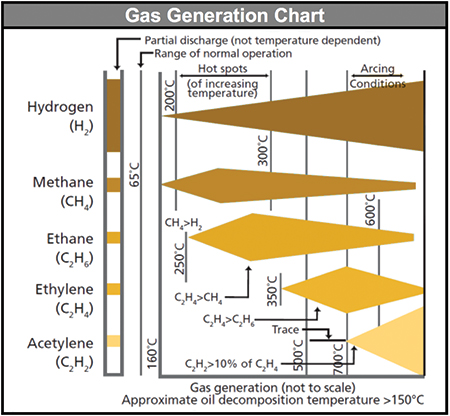
Hydrogen and methane begin to form in small amounts around 150 °C. The production of hydrogen continues to increase as the temperature increases. At about 250 °C, the production of ethane starts. At about 350 °C, the production of ethylene starts. After reaching their maximum points, methane, ethane, and ethylene production goes down as the temperature increases.
Acetylene production begins between 500 and 700 °C. In the past, the presence of only trace amounts of acetylene was considered to indicate a temperature of at least 700 °C had occurred, however, recent discoveries have led to the conclusion that a thermal fault (hot spot) of 500 °C can produce trace amounts (a few ppm). Larger amounts of acetylene can only be produced above 700 °C by internal arcing.
Between 200 and 300 °C, the production of methane exceeds that of hydrogen. Starting at about 275 °C and up, the production of ethane exceeds that of methane. At about 450 °C, hydrogen production exceeds all other gases until about 750 to 800 °C, at which point a larger amount of acetylene is produced.
Thermal decomposition of cellulose materials will also begin at about 100 °C or less and produce carbon monoxide (CO), carbon dioxide (CO2), hydrogen (H2), methane (CH4), and oxygen (O2). Therefore it is imperative to operate transformers below 90 °C.
Types of Faults
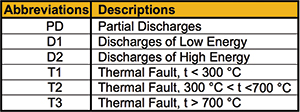
A proper fault diagnosis will include warnings of any gases with concentrations, increments, rates of change, or ratios that exceed the standard limits, along with short interpretive remarks and recommendations based on the findings. To help identify the different faults when a diagnosis is being made, the following classes have been identified after the physical inspection of hundreds of faulty transformers detectable by visual inspections and DGA results. They are also summarized in Figure 2.
Partial Discharge (PD) – the corona type occurs, which can result in deposits of ‘X-Wax’ on paper insulation, or the sparking type occurs, which can induce pinholes (carbonized punctures) in paper that may be difficult to find.
Discharges of Low Energy (D1) – occurs in oil and/or paper, as indicated by large carbonized punctures in paper (pinholes), carbonization of the paper surface (tracking), or carbon particles in oil (as in an LTC).
Discharges of High Energy (D2) – occurs in oil and/or paper, as indicated by extensive destruction and carbonization of paper or metal fusion at the discharge extremes, extensive carbonization in oil, and in some cases, tripping of the equipment confirming a large current follow-through.
Thermal Fault (T1) – occurs in oil and/or paper below 300 °C, turning the paper “brownish”.
Thermal Fault (T2) – occurs in oil and/or paper above 300 °C and below 700 °C, carbonizing the paper.
Thermal Fault (T3) – occurs in oil and/or paper above 700 °C with strong evidence of carbonization of the oil, metal coloration (at 800 °C), or metal fusion (below 1,000 °C).
Figure 2
Fault Identification by Gas Type
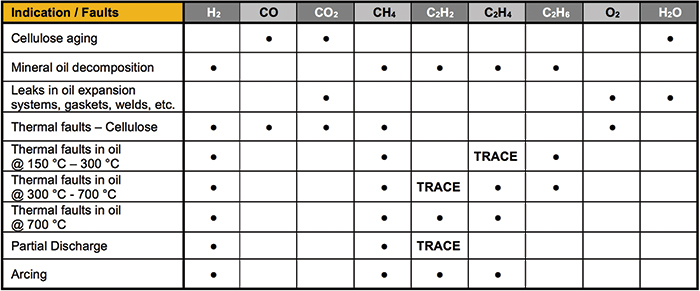
Potential faults such as over-heating, partial discharge, and sustained arcing produce a range of gases. The concentrations and composition of these gases can be used to identify the type and estimate the severity of the fault, as shown in Figure 3. Since all types of faults create a variety of gases and not just one, the diagnostic approaches that detect multiple gases and account for the entire gassing picture often get more accurate results.
Figure 3
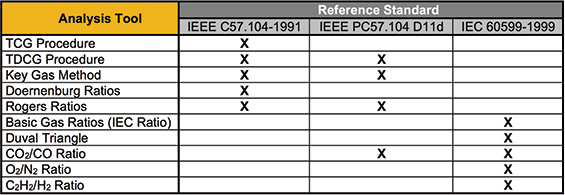
DGA Diagnostic Tools
Most of the DGA diagnostic tools in use today can be found in the IEEE C57.104 or IEC 60599 guides. Based on these two guides, other national and international guides that include additional tools are also available, but for our purposes we will only discuss those tools found in the IEEE and IEC guides. Figure 4 summarizes the diagnostic tools that we will be discussing, as found in the latest IEEE guide, a recent draft standard (IEEE C57.104- D11d; not approved) of the IEEE guide, and the IEC guide.
Figure 4
DGA Diagnostic Tool Selection
There is a wide range of diagnostic tools available for DGA. Some are simpler, using only sums or single ratios of gases, alongside a guideline, to determine different warning levels. Others are more complex, taking multiple gas ratios and fitting them to a precise range of values.
Total Combustible Gas (TCG) procedure and Total Dissolved Combustible Gas (TDCG) procedure are the two diagnostic tools that are non-ratio based. TCG deals with the gases in the gas headspace and TDCG the gases dissolved in oil. They can offer an indication that gas levels are increasing and provide suggested guidelines for operators to perform manual DGA sampling intervals. However, since they do not offer any significant diagnostic value regarding fault type, it is recommended by the IEEE guide to combined them with other diagnostic tools in order to get a better understanding of what is happening in the transformer.
There are three more diagnostic tools that may also be used as a complement to other diagnosis methods for a more accurate assessment of transformer conditions. These are the CO2/CO ratio, the O2/N2 ratio and the C2H2/H2 ratio, as described in further detail below.
CO2/CO Ratio – this popular ratio is used to detect paper involvement in a fault. If the ratio is below 3, it is a strong indication of a fault in paper, either a hot spot or electrical arcing with a temperature above 200 °C. If the ratio is above 10, it indicates a fault with a temperature below 150 °C. However, this ratio is not very accurate because it is affected by the CO2 and CO coming from oil oxidation and normal cellulose aging, so with a high quantity of CO2, seeing a significant change in the CO2/CO ratio is nearly impossible.
O2/N2 Ratio – a decrease of this ratio indicates excessive heating.
C2H2/H2 Ratio – a ratio between 2 and 3 in the main tank indicates contamination by the LTC compartment. In these situations the level of acetylene in the main tank can be quite high, so in order to diagnose true main tank problems, incremental changes in acetylene must be monitored.
The remaining DGA diagnostic tools that we will discuss are considered to be the main interpretation methods used for fault diagnosis of power transformers. This includes the Key Gas, Dornenburg Ratio, Rogers Ratio, IEC Basic Gas Ratio, Duval Triangle, and CIGRE ratio methods. The majority of these methods are ratio-based, meaning they use a subset of the ratios below to diagnose a fault type based on the fit of each ratio result to a specific range of values:
- Ratio 1 (R1) = CH4/H2
- Ratio 2 (R2) = C2H2/C2H4
- Ratio 3 (R3) = C2H2/CH4
- Ratio 4 (R4) = C2H6/C2H2
- Ratio 5 (R5) = C2H4/C2H6
It is important to remember that when using ratio-based diagnostic tools, minimum gas levels are required as defined in the guides, for the ratio analysis to be considered valid.
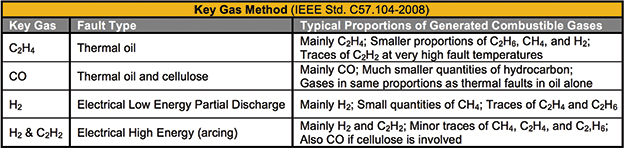
Key Gas Method
The Key Gas method is based on the quantity of fault gases that are released from the insulating oil as the chemical structure breaks at varying temperatures in the transformer. This method uses individual gas levels, or ‘key gases,’ for detecting faults. Figure 5 summarizes the key gases and their fault indications.
Figure 5
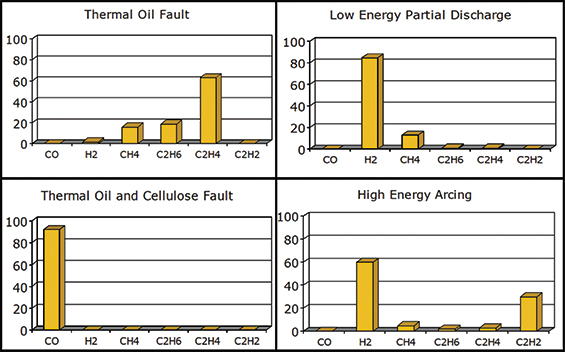
This method offers diagnostics by calculating the relative proportions (in percent) of the key gases within the transformer. Figure 6 indicates these key gases and their relative proportions to indicate the four general types of faults.
Figure 6
Doernenburg Ratio Method (DRM)
The Doernenburg method can be found in the IEEE C57.104-1991 guide. It has fallen out of favor in some parts of the world due to its complexity and the evolution of it into the Rogers Ratio and Basic Gas Ratios approaches, but compared to other diagnostic methods, the DRM still holds its value as one of the more effective diagnostic tools available.
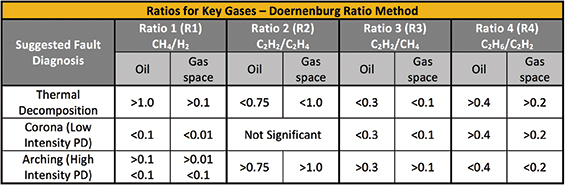
In order to use the DRM, the concentration of one of the key gases (H2, C2H2, C2H4, C2H6, or CH4) needs to be at least double the relevant L1 concentrations, as shown in Figure 7. When this criterion is met, there are four possible ratios that can be calculated if they contain the key gas of concern. Figure 8 shows the proposed fault diagnostics is based on the ranges of the four ratios. The IEEE standard (IEEE C57.104-1991) also has an illustrated step-by-step application of this ratio method for gases extracted from the transformer oil only.
Figure 7
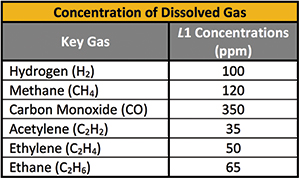
Figure 8
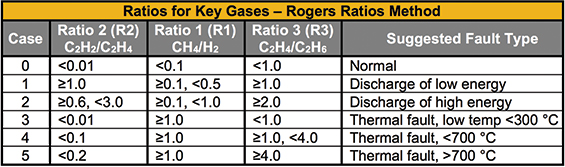
Rogers Ratio Method (RRM)
The Rogers Ratio method evolved from the Doernenburg method and is used exactly the same way, but instead of needing significant concentrations of the key gases, the RRM can be used when the concentrations exceed the values listed in Figure 7 (rather than double).
Values for the three gas ratios, corresponding to suggested diagnostic cases, are shown in Figure 9. The fault types (cases) that are provided have been chosen by combining some cases from the number of fault types originally suggested by Rogers.
Figure 9
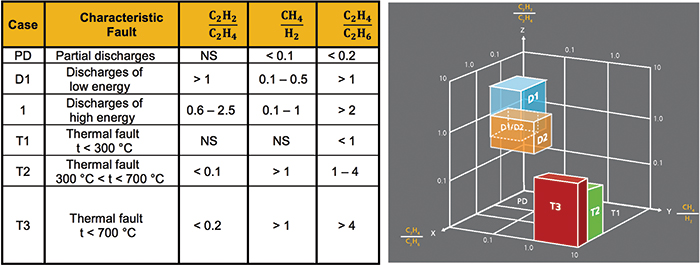
Despite having better accuracy, the Doernenburg Ratio, Rogers Ratio, and Basic Gas Ratio approaches have one drawback where some combinations of gases do not fit into the specified range of values when calculated and the fault type cannot be determined. To further demonstrate this, Figure 10 shows a three-dimensional view of the Basic Gas Ratio (IEC 60599-2007-05).
Figure 10
Duval Triangle Method (DTM)
The Duval Triangle method was developed from IEC TC10 databases and an existing IEC 60599 Ratio method. Approximately 200 plus inspected fault cases in service were used to develop the Triangle. Within the triangle there are six (6) potential fault zones covering partial discharges, electrical faults (arcing high and low energy), and thermal faults (over various temperature ranges), plus a DT zone (mixture of thermal and electrical faults).
The use of the DTM is based upon three key gases (CH4, C2H4, and C2H2) that correspond to the increasing energy levels of gas formation, as shown in Figure 11. These gas concentrations are calculated and then plotted along the three sides of a triangle diagram using the following ratios:
- %CH4 = (CH4/CH4+C2H2) x 100
- %C2H4 = (C2H4/CH4+C2H4+C2H2) x 100
- %C2H2 = (C2H2/CH4+C2H4+C2H2) x 100
Figure 11
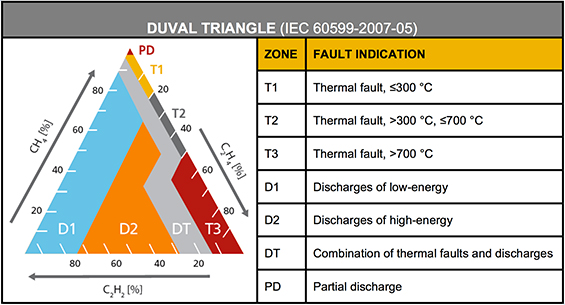
As previously stated, one drawback of the gas ratio methods is that some results can fall outside the codes and no diagnostics can be given (unresolved diagnostics). This does not occur with the Duval Triangle method because it is a ‘closed system.’ It always provides a diagnosis, with a low percentage of wrong diagnoses. In fact, according to some published reports, the DTM provides more accurate and consistent diagnoses than any other method available at this time.
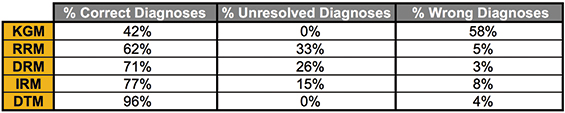
Diagnostic Methods Summary
The most important aspect of DGA diagnostic methods is being able to correctly diagnosis recent or potential faults within a monitored transformer. With that in mind, the main DGA interpretation methods discussed in this paper are summarized in Figure 12 and their accuracy is shown in Figure 13, as evaluated using the IEC data bank of inspected transformer failures and various other reports.
Figure 12
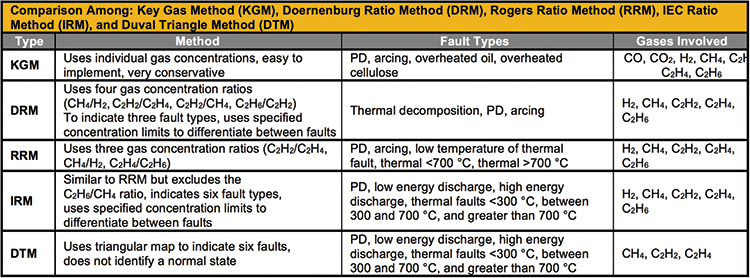
Figure 13
Conclusion
In this paper we presented the DGA diagnostic tools that have the ability to provide results indicating a specific type of fault that is either present or pending to occur in a transformer. This information can then be used to determine the appropriate course of action for that specific transformer. For example, some faults can be considered less severe than others and the transformer can be allowed to continue operating without immediate action to shut down and remove power.
Understanding the available DGA diagnostic methods can be overwhelming, especially when the various types of techniques are taken into perspective. If, for instance, the only technique used, is to take manual oil samples, send them to an oil laboratory, and then wait for the results and direction from the lab, the various diagnostic tools presented here are not applicable because everything is being determined by the oil laboratory used. However, if the end user wants to analyze the oil samples and get results on their own, then the techniques and methods discussed will need to be fully understood so that they are properly used.
The key objective in DGA of fault gases is to correctly diagnose the fault that is potentially generated. Some diagnostic tools have the ability to perform better than others, so it’s important to review the most recent information when incorporating them into DGA procedures.
We have presented and discussed the most common methods for analyzing dissolved gas data to interpret potential fault types, including the Key Gas, Dornenburg Ratio, Rogers Ratio, IEC Ratio, Duval Triangle, and CIGRE methods. Keep in mind that many of these methods may yield conflicting diagnoses for the same oil sample and some results from the ratio methods (Dornenburg, Rogers, and IEC) may be unresolved (no diagnosis). With the Duval Triangle Method, this is not a concern. The two independent studies, as previously described, have shown that the Duval Triangle Method resulted in a 96 percent correct rate of the determination of a transformer fault and although it had a higher percentage of wrong diagnostics than the DRM, it had a lower rate of 0 percent for ‘unresolved’ diagnostics.
The Future
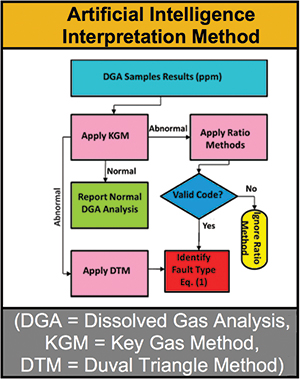
DGA diagnosis techniques presented thus far use fault gas concentrations or ratios based on the practical experience of various experts, rather than on quantitative evidence. Now, with the availability of extensive DGA data, researchers are motivated to develop an alternative approach to DGA data interpretation alone. These different or alternate approaches include artificial intelligence (AI) techniques, Fuzzy logic, and neural networks techniques.
Recent development of the artificial intelligent (AI) model based on a combination of KGM, DRM, RRM, and DTM techniques shows some future insight, as shown in Figure 14. AI approaches provide more accurate and reliable transformer diagnoses than KGM, DRM, RRM, and DTM alone. However, even though a majority of the AI approaches can diagnose faults with high accuracy, some of them fail to distinguish between thermal faults in oil and the same faults in cellulose, so engineering judgment is still required.
Figure 14
About the Author
 Jeff Golarz, Director, T&D Solutions & Gas Products with LumaSense Technologies, Inc. Jeff has over 25 years of experience in the design, development, manufacturing, and sales of electronic devices and systems for industrial control equipment and systems. He currently holds the position of Director Business Development T&D Solutions for LumaSense Technologies. He has worked as VP Sales and Marketing Manager, Sr. Product Director, Sales and Marketing Director, Business Development Manager, Program Manager and has been Engineering Manager for various high-tech electronics companies. He most recently held the position of Business Development Manager, ABB Substation Automation Systems. Prior to ABB, Jeff was the Sr. Product Development Manager at BPLG/Serveron responsible for the Transformer DGA monitors and other substation solutions products. He is a member of IEEE, PES, IEE Transformer Standards, and several energy working groups, including CIGRE North America. Jeff has a degree in Mechanical Engineering, a degree in Electronic Control Engineering, and is currently working toward his Master’s Degree in Business Administration.
Bibliography
- David Woodcock, “Risk-Based Reinvestment – Trends in Upgrading the Aged T&D System”, Energy Pulse, March 12, 2004
- William H. Bartley, “Analysis of Transformer Failures”, paper IMIA-WGP 33 (03), International Association of Engineering Insurers, 2003
- M. Duval and J. Dukarm, “Improving the Reliability of Transformer Gas-in-Oil Diagnosis”, IEEE Elec. Insul. Mag., Vol.21, No.4, pp. 21-27, 2005.
- M.Duval and A.dePablo, “Interpretation of Gas-in-Oil Analysis using new IEC Publication 60599 and IEC TC10 Data Bases”, IEEE Elec. Insul. Mag., Vol.17, No.2, pp.31-41, 2001.
- M. Duval, Dissolved Gas Analysis: A Powerful Maintenance Tool for Transformers, TJH2b NA TechCon, 2004
- N.A. Muhamad, B.T. Phung, T.R. Blackburn, K.X Lai; “Comparative Study and Analysis of DGA Methods for Transformer Mineral Oil”; The University of New South Wales, School of Electrical Engineering and Telecommunications, Sydney 2052, Australia
- Baker, N., Abu-Sida and S, Islam; “A Review of Dissolved Gas Analysis Measurement and Interpretation Techniques”, IEEE DEIS magazine, May/June – Vol. 30, No.3, p39-49, 2014
- Guide for the Interpretation of Gases Generated in Oil-Immersed Transformers, IEEE Std. C57.104-1991, 1991