
ABB Introduces Voltage Assessment Tool
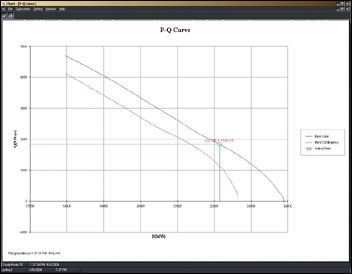
ABB’s Voltage Security Assessment (VSA) application computes the voltage collapse curve for increasing loading condition both for the real time network condition as well as for worse contingencies. These P-V curves provide the critical operating MW limit for which the grid reliability is protected against the worst contingencies. Predicting this critical point is crucial to the grid operator because it provides the operating margin with which he is currently operating the system. By monitoring this margin, the operator can make decisions that will continue to maintain the grid reliability.
The voltage collapse curves and the critical point computed for a practical network model of 5000 load flow busses are shown in Figure 1. The critical point is the MW operating point on the base voltage curve at which voltage collapse occurs for a worst contingency minus the operator selected safe margin.
The blackout of August 14, 2003 thrust the issue of transmission grid reliability into national prominence. Since then, the energy industry, congress and even the public have voiced concerns over the deficiencies that have been exposed in the technologies, standards and processes governing reliability management. This scrutiny is gradually changing the perception of what should be required of energy management systems and the people who use them.
Of the many lessons learned in the aftermath of the blackout, two emerge as particularly valuable. The first is that deregulation has changed energy transmission patterns, resulting in energy flowing through the network in ways the grid was not designed to handle. It is nearly impossible to simulate failures in the grid when the flow of energy cannot be predicted in advance. This dramatically increases the chances that when a failure occurs, control center personnel will have had little or no experience recognizing it and dealing with it properly.
The second big lesson is that the traditional “N-1” contingency analysis is not adequate. Traditionally, utilities operated their systems so as to be safe against the first (or in some cases the first and second) worst “credible” contingency – meaning the worst single outage event to a transmission line, generator, transformer, or substation busbar that was deemed “credible” or possible within some range of reasonability. When doing system planning, utilities aimed to meet standards for the “Loss of Load Probability” derived from statistics for generation outages – meaning that sufficient generation reserves should be available to meet statistically expected outages such as to keep the expected MW Hours of load lost in a year under the LOLP standard. Transmission was planned so as to not cause an outage within the “N-1” criteria. Standards for operating the systems were similarly established.
What the blackout showed is that the first transmission outage can in fact make the second and subsequent outages more likely to happen, and that in the real world multiple outages are in fact “credible” – often with linked root causes of human error in maintenance and operations.
Energy management system (EMS) technology and the standards and procedures related to it are the focal point for the changes that must be made. For most utilities, the solution can be carried out in two phases. In the near term, transmission companies must leverage the key resources they already have – control center systems and personnel – by training their staffs to use existing EMS capabilities to prepare for failures and handle them effectively.
In the long term, utilities must work with system vendors and researchers to upgrade EMS technology. Enhancements must be developed to improve alarm filtering, alarm display, inter-grid data sharing, system modeling and reliability analysis tools. This is especially true as ISOs grow in the scope of power systems under their management and operators are tasked with monitoring larger and larger grids.
Leveraging Existing Resources
Almost every control center deployed since the late 1980s was designed with built-in training simulation capabilities. These applications, similar to flight simulators used by airlines, simulate the transmission grid and give control room operators the chance to practice responding to failures and outages. The drawback to these simulators is that they require not only an upfront financial investment by the utility but also an ongoing commitment and budget to make use of them.
Most systems need engineers to plan and set up the simulation, which is often carried out during an extra shift. Such expenditures have been cut from the budgets of many utilities. KEMA is conducting a benchmark study of this situation and has found that a significant fraction of transmission companies are not fully using the simulation applications in their existing EMS.
Utilities, however, may soon have no choice but to invest in these training exercises. One response to the blackout that is being discussed is whether operator certification (today a written NERC test) should include periodic simulator training as is required of airline pilots and nuclear plant operators. In addition, utilities are likely to find they must hire third parties to audit control room training and simulation exercises that meet tightly regulated standards.
The whole approach to monitoring transmission grid reliability in real time and in preparing operational plans a day to a year ahead of time will also come under scrutiny. Utility operations may be able to borrow a page from the Enterprise Risk Management practices of the financial industry.
Banks assess their financial risks by examining the historical ebbs and flows of the markets that impact their business and their investment portfolios. These variations occur with somewhat predictable frequency on cycles throughout the day, month and year. Based on historical occurrences, banks keep extra capital on hand to cover those risks during the specified periods. Transmission companies have typically done the same thing by ensuring that excess energy is available during predictable peak periods of demand.
But banks also employ global risk assessment strategies to account for failures outside of market forces. For instance, a rogue bond trader or a human error can literally cause a financial crisis overnight, which absent regulatory intervention could trigger a domino effect of failures. Because such events are rare, there is no published set of statistics to use in quantifying the risk as there are available for estimating market price induced risk.
The financial community recognized this flaw and began sharing data on unpredictable incidents so that statistics could be developed to calculate risk. Banks, as a result, now keep money in reserve to compensate for the unpredictable and a body of theoretical work and policies are developed to deal with what is called “operational risk”. Transmission companies can borrow this strategy for many of the same reasons. Instead of looking at the first “credible” contingency, many more and more incredible contingencies should be examined, and more importantly, operations should consider the underlying events that can trigger multiple contingencies and plan for them. Transmission lines that share right of ways are vulnerable to common root causes from vegetation to helicopters; substations are especially vulnerable when work is going on in them, and so on. (Admittedly, many operations do carefully look at issues arising from shared right of ways, but it is not common practice to focus reliability analyses on the potential impacts of crew errors while working in a substation.)
To highlight this point, the August 14 blackout is considered a rare event. But was it really? Italy experienced a remarkably similar outage last summer that was brought on by many of same factors – deregulation and operator error – that caused the North American event. So, two once-in-a-lifetime blackouts occurred in the same summer. What are the odds of that? Perhaps better than anyone imagined.
These events underscore the fact that the current states of energy markets worldwide have changed the definition of acceptable risk. This points to the need for more effective use of online state estimation and contingency analysis models within the EMS. For those utilities actually still using them, these models take measurements of network conditions and continuously analyze what-if scenarios.
There are currently two problems with the ways these models are used. First, they are not kept up-to-date on the existing configuration of the transmission network. As with simulation, maintaining these models requires constant investment. Generally speaking, one operations engineer must dedicate about 20 hours a week to keeping the analysis models updated. While more utilities are continuing to make use of these tools than have kept their training simulators in use, there are some that have scaled back staff budgets and focus under the assumption that “the ISO is doing that now.”
The other limitation is computer power. The traditional life cycle for an EMS has been 10 years and there are more than a few that were first contracted for in the late 1980’s still operational. As a result, online state estimation models may be run infrequently and online security analyses are restricted in the number of contingency scenarios they can analyze. Out of habit, most utilities select the 50 risk issues concerning them the most and include them in the modeling. Recent history and the concept of global risk assessment, however, have taught us that even the most unlikely failures must be considered.
Today the software and hardware available in EMS systems is capable of far better, and the capital outlays for a new EMS are dramatically reduced over what was required 10 years ago. As with past blackouts, we should expect this one to lead to a flurry of EMS modernization.
Enhancing EMS Technology
Recent outage events have demonstrated that analytical tools monitoring conditions in the grid and algorithms modeling network performance can fail under extreme situations. They were not designed to model the kinds of severely depressed voltages and overloaded circuits that many grids now experience. The load flow algorithms available to the industry until very recently were unable to converge reliably when system voltages were depressed. This made it difficult for contingency analyses to accurately predict the final outcome of severe outages, especially when systems are heavily loaded. The more detailed transient simulations required to assess these cases were computationally too cumbersome to be practical for online use. This is a case of “when you need it the most is when it can’t be counted on to work” – an unacceptable situation. New algorithms and new research are required to address this fundamental problem.
Voltage instability or voltage collapse is one of the important grid reliability factors contributing to major blackouts that must be detected earlier. If this voltage instability can be predicted against all possible contingencies in advance, taking preventative steps to avoid the occurrence can protect grid reliability. One vendor that has already introduced this type of new technology is ABB, which recently unveiled its Voltage Security Assessment (VSA) application to detect voltage instability.
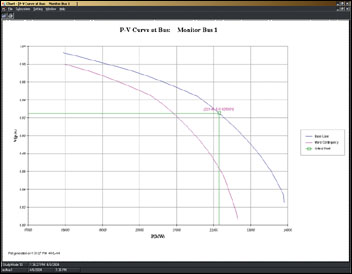
The VSA application should be executed periodically and uses the State Estimation solution as the current operating point. It continuously evaluates and displays to the operator the margin to the critical point. In addition to the prediction of this critical point, VSA determines the weakest load flow busses in the system that exhibit the worst voltage drops, thus contributing to the collapse (Figure 2). The operator can monitor the voltage of these critical busses against voltages of these busses corresponding to the critical point to determine how close the current operating point is to the possible collapse point.
Since the collapse is related to not having enough reactive power to support the voltage, monitoring the reactive power reserve and maintaining the required reserve in the right area will prevent possible voltage collapse. VSA provides displays showing the current reactive reserve and the critical reactive reserve (corresponding to the critical point).
VSA can be set up to determine the operating limit for the flow gates, which are interfaces where major power is imported. This application can be executed in study mode to determine preventive actions. VSA can be executed in a day-head schedule to ensure there is enough margin to critical point for all 24 hours of the next day as part of determining the day-ahead schedule in the power market design. ABB’s VSA has been tested with large models and is being field tested in several EMS projects.
-- Mani Subramanian, Director, ABB Network Management, Sugar Land, Texas.
The first technological step for the industry to take, therefore, is to upgrade EMS algorithms and models to operate under a broader spectrum of grid conditions and to simulate the once-in-a-lifetime outage scenarios that most operators believe could never strike their utility. KEMA and others have suggested that contingency analyses and operational planning should shift from the “N-1 ” model to a stochastic model that considers a wider range of possible events in a probabilistic framework. Such an approach would produce an assessment of the likelihood of major problems that could be used in a risk-cost tradeoff, for instance, in determining whether and how much load to shed in rotating brownouts and black-outs.
Some EMS vendors are already working on this objective, and the U.S. Department of Energy plans to fund research into improved network modeling tools.
The next step that must be taken to enhance control center technology involves alarm systems. Current EMS technology can’t always process the number of alarms coming into the control center during a major failure. These systems must be upgraded to handle ten times their current alarm processing capacity. Once the EMS system can handle the large flood of alarms, the next problem is that the human operators have to be able to handle them intelligently – it is no good to overwhelm the operator with more alarm messages than can be read in a day.
Alarm filtering is a hot topic that many EMS vendors have begun considering. The concept is for the system to recognize only the most crucial alarms and forward them to the operator to deal with. Other secondary, tertiary and repeat alarms will be suppressed and logged for later analysis. More valuable analysis of root cause and probable cause can be performed using Rule based, inference engines, and fuzzy logic as are widely used in other process industries. The industry can expect improved filtering and suppression capabilities in the near future.
Another drawback to existing alarm systems is their presentation to the control room. In most cases, alarms signal audible warnings and scroll text messages across the operator’s computer screen. One line diagrams of the transmission grid and the substations show flashing breaker symbols or analog flow and voltage readings. Even with just the prioritized warnings onscreen, the operator can be inundated trying to read the messages and relate them to what is occurring in the network. For this reason, EMS developers need to borrow graphical representation techniques commonly used in geospatial applications to visualize incidents and locations. While the full graphics displays in today’s EMS systems are better looking and more interesting to use than those of 15 and 20 years ago, the fundamental concepts have not changed or significantly improved in all that time.
The previous major blackouts of 1965 and 1977 both triggered rounds of investment and R&D in system operations. The 1965 blackout led to major developments in network analysis and a wave of control center investments in state estimation, contingency analysis and improved measurement and telecommunications. The 1977 outage led to investment in training simulator technologies and usage. But during the 90’s the rate of investment in new capabilities slowed and the EMS R&D dollars went to porting the same functionality to new computer platforms – to UNIX and to full graphics displays. And in the late 90’s and early years of the millennium, all the development emphasis has been on tools for market operations.
Conclusion
In the short term, the industry will respond to the blackout with new policies and procedures for system planning and operations. The investments will be in people, policy, and process. The focus will have to be on making better use of already deployed technologies. This phase is already well underway and will accelerate during 2004 and 2005. The second phase will be an investment in new capabilities in control rooms, more communications, and better control. Some utilities are already making plans this year for projects to begin late in the year or next year and we can expect this activity to increase. R&D organizations from DOE to EPRI to vendors and universities are turning their attention to needed new solutions. The third phase of response, actual investment in the grid and in new transmission technologies, will take longer to bring about due to broad issues of funding and approval cycles.
ABOUT THE AUTHOR
Ralph Masiello is Senior Vice President, Energy Systems Consulting with Burlington, Massachusetts-based KEMA Inc. Mr. Masiello has over 20 years experience in transmission and distribution operations, implementation and control systems at many of North America’s largest utilities, energy scheduling and optimization, and control center projects, including the setup of systems for energy markets and ISOs around the world.
Mr. Masiello can be reached at: rmasiello@ kemaconsulting.com.
ABB’s Voltage Security Assessment (VSA) application computes the voltage collapse curve for increasing loading condition both for the real time network condition as well as for worse contingencies. These P-V curves provide the critical operating MW limit for which the grid reliability is protected against the worst contingencies. Predicting this critical point is crucial to the grid operator because it provides the operating margin with which he is currently operating the system. By monitoring this margin, the operator can make decisions that will continue to maintain the grid reliability.
The voltage collapse curves and the critical point computed for a practical network model of 5000 load flow busses are shown in Figure 1. The critical point is the MW operating point on the base voltage curve at which voltage collapse occurs for a worst contingency minus the operator selected safe margin.
The blackout of August 14, 2003 thrust the issue of transmission grid reliability into national prominence. Since then, the energy industry, congress and even the public have voiced concerns over the deficiencies that have been exposed in the technologies, standards and processes governing reliability management. This scrutiny is gradually changing the perception of what should be required of energy management systems and the people who use them.
Of the many lessons learned in the aftermath of the blackout, two emerge as particularly valuable. The first is that deregulation has changed energy transmission patterns, resulting in energy flowing through the network in ways the grid was not designed to handle. It is nearly impossible to simulate failures in the grid when the flow of energy cannot be predicted in advance. This dramatically increases the chances that when a failure occurs, control center personnel will have had little or no experience recognizing it and dealing with it properly.
The second big lesson is that the traditional “N-1” contingency analysis is not adequate. Traditionally, utilities operated their systems so as to be safe against the first (or in some cases the first and second) worst “credible” contingency – meaning the worst single outage event to a transmission line, generator, transformer, or substation busbar that was deemed “credible” or possible within some range of reasonability. When doing system planning, utilities aimed to meet standards for the “Loss of Load Probability” derived from statistics for generation outages – meaning that sufficient generation reserves should be available to meet statistically expected outages such as to keep the expected MW Hours of load lost in a year under the LOLP standard. Transmission was planned so as to not cause an outage within the “N-1” criteria. Standards for operating the systems were similarly established.
What the blackout showed is that the first transmission outage can in fact make the second and subsequent outages more likely to happen, and that in the real world multiple outages are in fact “credible” – often with linked root causes of human error in maintenance and operations.
Energy management system (EMS) technology and the standards and procedures related to it are the focal point for the changes that must be made. For most utilities, the solution can be carried out in two phases. In the near term, transmission companies must leverage the key resources they already have – control center systems and personnel – by training their staffs to use existing EMS capabilities to prepare for failures and handle them effectively.
In the long term, utilities must work with system vendors and researchers to upgrade EMS technology. Enhancements must be developed to improve alarm filtering, alarm display, inter-grid data sharing, system modeling and reliability analysis tools. This is especially true as ISOs grow in the scope of power systems under their management and operators are tasked with monitoring larger and larger grids.
Leveraging Existing Resources
Almost every control center deployed since the late 1980s was designed with built-in training simulation capabilities. These applications, similar to flight simulators used by airlines, simulate the transmission grid and give control room operators the chance to practice responding to failures and outages. The drawback to these simulators is that they require not only an upfront financial investment by the utility but also an ongoing commitment and budget to make use of them.
Most systems need engineers to plan and set up the simulation, which is often carried out during an extra shift. Such expenditures have been cut from the budgets of many utilities. KEMA is conducting a benchmark study of this situation and has found that a significant fraction of transmission companies are not fully using the simulation applications in their existing EMS.
Utilities, however, may soon have no choice but to invest in these training exercises. One response to the blackout that is being discussed is whether operator certification (today a written NERC test) should include periodic simulator training as is required of airline pilots and nuclear plant operators. In addition, utilities are likely to find they must hire third parties to audit control room training and simulation exercises that meet tightly regulated standards.
The whole approach to monitoring transmission grid reliability in real time and in preparing operational plans a day to a year ahead of time will also come under scrutiny. Utility operations may be able to borrow a page from the Enterprise Risk Management practices of the financial industry.
Banks assess their financial risks by examining the historical ebbs and flows of the markets that impact their business and their investment portfolios. These variations occur with somewhat predictable frequency on cycles throughout the day, month and year. Based on historical occurrences, banks keep extra capital on hand to cover those risks during the specified periods. Transmission companies have typically done the same thing by ensuring that excess energy is available during predictable peak periods of demand.
But banks also employ global risk assessment strategies to account for failures outside of market forces. For instance, a rogue bond trader or a human error can literally cause a financial crisis overnight, which absent regulatory intervention could trigger a domino effect of failures. Because such events are rare, there is no published set of statistics to use in quantifying the risk as there are available for estimating market price induced risk.
The financial community recognized this flaw and began sharing data on unpredictable incidents so that statistics could be developed to calculate risk. Banks, as a result, now keep money in reserve to compensate for the unpredictable and a body of theoretical work and policies are developed to deal with what is called “operational risk”. Transmission companies can borrow this strategy for many of the same reasons. Instead of looking at the first “credible” contingency, many more and more incredible contingencies should be examined, and more importantly, operations should consider the underlying events that can trigger multiple contingencies and plan for them. Transmission lines that share right of ways are vulnerable to common root causes from vegetation to helicopters; substations are especially vulnerable when work is going on in them, and so on. (Admittedly, many operations do carefully look at issues arising from shared right of ways, but it is not common practice to focus reliability analyses on the potential impacts of crew errors while working in a substation.)
To highlight this point, the August 14 blackout is considered a rare event. But was it really? Italy experienced a remarkably similar outage last summer that was brought on by many of same factors – deregulation and operator error – that caused the North American event. So, two once-in-a-lifetime blackouts occurred in the same summer. What are the odds of that? Perhaps better than anyone imagined.
These events underscore the fact that the current states of energy markets worldwide have changed the definition of acceptable risk. This points to the need for more effective use of online state estimation and contingency analysis models within the EMS. For those utilities actually still using them, these models take measurements of network conditions and continuously analyze what-if scenarios.
There are currently two problems with the ways these models are used. First, they are not kept up-to-date on the existing configuration of the transmission network. As with simulation, maintaining these models requires constant investment. Generally speaking, one operations engineer must dedicate about 20 hours a week to keeping the analysis models updated. While more utilities are continuing to make use of these tools than have kept their training simulators in use, there are some that have scaled back staff budgets and focus under the assumption that “the ISO is doing that now.”
The other limitation is computer power. The traditional life cycle for an EMS has been 10 years and there are more than a few that were first contracted for in the late 1980’s still operational. As a result, online state estimation models may be run infrequently and online security analyses are restricted in the number of contingency scenarios they can analyze. Out of habit, most utilities select the 50 risk issues concerning them the most and include them in the modeling. Recent history and the concept of global risk assessment, however, have taught us that even the most unlikely failures must be considered.
Today the software and hardware available in EMS systems is capable of far better, and the capital outlays for a new EMS are dramatically reduced over what was required 10 years ago. As with past blackouts, we should expect this one to lead to a flurry of EMS modernization.
Enhancing EMS Technology
Recent outage events have demonstrated that analytical tools monitoring conditions in the grid and algorithms modeling network performance can fail under extreme situations. They were not designed to model the kinds of severely depressed voltages and overloaded circuits that many grids now experience. The load flow algorithms available to the industry until very recently were unable to converge reliably when system voltages were depressed. This made it difficult for contingency analyses to accurately predict the final outcome of severe outages, especially when systems are heavily loaded. The more detailed transient simulations required to assess these cases were computationally too cumbersome to be practical for online use. This is a case of “when you need it the most is when it can’t be counted on to work” – an unacceptable situation. New algorithms and new research are required to address this fundamental problem.
Voltage instability or voltage collapse is one of the important grid reliability factors contributing to major blackouts that must be detected earlier. If this voltage instability can be predicted against all possible contingencies in advance, taking preventative steps to avoid the occurrence can protect grid reliability. One vendor that has already introduced this type of new technology is ABB, which recently unveiled its Voltage Security Assessment (VSA) application to detect voltage instability.
The VSA application should be executed periodically and uses the State Estimation solution as the current operating point. It continuously evaluates and displays to the operator the margin to the critical point. In addition to the prediction of this critical point, VSA determines the weakest load flow busses in the system that exhibit the worst voltage drops, thus contributing to the collapse (Figure 2). The operator can monitor the voltage of these critical busses against voltages of these busses corresponding to the critical point to determine how close the current operating point is to the possible collapse point.
Since the collapse is related to not having enough reactive power to support the voltage, monitoring the reactive power reserve and maintaining the required reserve in the right area will prevent possible voltage collapse. VSA provides displays showing the current reactive reserve and the critical reactive reserve (corresponding to the critical point).
VSA can be set up to determine the operating limit for the flow gates, which are interfaces where major power is imported. This application can be executed in study mode to determine preventive actions. VSA can be executed in a day-head schedule to ensure there is enough margin to critical point for all 24 hours of the next day as part of determining the day-ahead schedule in the power market design. ABB’s VSA has been tested with large models and is being field tested in several EMS projects.
-- Mani Subramanian, Director, ABB Network Management, Sugar Land, Texas.
The first technological step for the industry to take, therefore, is to upgrade EMS algorithms and models to operate under a broader spectrum of grid conditions and to simulate the once-in-a-lifetime outage scenarios that most operators believe could never strike their utility. KEMA and others have suggested that contingency analyses and operational planning should shift from the “N-1 ” model to a stochastic model that considers a wider range of possible events in a probabilistic framework. Such an approach would produce an assessment of the likelihood of major problems that could be used in a risk-cost tradeoff, for instance, in determining whether and how much load to shed in rotating brownouts and black-outs.
Some EMS vendors are already working on this objective, and the U.S. Department of Energy plans to fund research into improved network modeling tools.
The next step that must be taken to enhance control center technology involves alarm systems. Current EMS technology can’t always process the number of alarms coming into the control center during a major failure. These systems must be upgraded to handle ten times their current alarm processing capacity. Once the EMS system can handle the large flood of alarms, the next problem is that the human operators have to be able to handle them intelligently – it is no good to overwhelm the operator with more alarm messages than can be read in a day.
Alarm filtering is a hot topic that many EMS vendors have begun considering. The concept is for the system to recognize only the most crucial alarms and forward them to the operator to deal with. Other secondary, tertiary and repeat alarms will be suppressed and logged for later analysis. More valuable analysis of root cause and probable cause can be performed using Rule based, inference engines, and fuzzy logic as are widely used in other process industries. The industry can expect improved filtering and suppression capabilities in the near future.
Another drawback to existing alarm systems is their presentation to the control room. In most cases, alarms signal audible warnings and scroll text messages across the operator’s computer screen. One line diagrams of the transmission grid and the substations show flashing breaker symbols or analog flow and voltage readings. Even with just the prioritized warnings onscreen, the operator can be inundated trying to read the messages and relate them to what is occurring in the network. For this reason, EMS developers need to borrow graphical representation techniques commonly used in geospatial applications to visualize incidents and locations. While the full graphics displays in today’s EMS systems are better looking and more interesting to use than those of 15 and 20 years ago, the fundamental concepts have not changed or significantly improved in all that time.
The previous major blackouts of 1965 and 1977 both triggered rounds of investment and R&D in system operations. The 1965 blackout led to major developments in network analysis and a wave of control center investments in state estimation, contingency analysis and improved measurement and telecommunications. The 1977 outage led to investment in training simulator technologies and usage. But during the 90’s the rate of investment in new capabilities slowed and the EMS R&D dollars went to porting the same functionality to new computer platforms – to UNIX and to full graphics displays. And in the late 90’s and early years of the millennium, all the development emphasis has been on tools for market operations.
Conclusion
In the short term, the industry will respond to the blackout with new policies and procedures for system planning and operations. The investments will be in people, policy, and process. The focus will have to be on making better use of already deployed technologies. This phase is already well underway and will accelerate during 2004 and 2005. The second phase will be an investment in new capabilities in control rooms, more communications, and better control. Some utilities are already making plans this year for projects to begin late in the year or next year and we can expect this activity to increase. R&D organizations from DOE to EPRI to vendors and universities are turning their attention to needed new solutions. The third phase of response, actual investment in the grid and in new transmission technologies, will take longer to bring about due to broad issues of funding and approval cycles.
ABOUT THE AUTHOR
Ralph Masiello is Senior Vice President, Energy Systems Consulting with Burlington, Massachusetts-based KEMA Inc. Mr. Masiello has over 20 years experience in transmission and distribution operations, implementation and control systems at many of North America’s largest utilities, energy scheduling and optimization, and control center projects, including the setup of systems for energy markets and ISOs around the world.
Mr. Masiello can be reached at: rmasiello@ kemaconsulting.com.