
Since their introduction to the market in the 1980s, submeters have dramatically evolved in terms of functionality and usefulness, and have proven themselves valuable ‘front-line' energy data gathering tools in an era of rising utility costs and tightening budgets. Submeters not only help operators to improve the facility bottom line, but facilitate implementation of building retro-commissioning projects and other energy initiatives while also encouraging facility occupants to become stakeholders in the energy management and conservation process through real-time and historical data presentment.

The level of sophisticated energy profiling needed by high-volume consumers is unobtainable using the standard utility meter found at the facility’s main electrical service entrance. In response to the need for greater granularity in terms of the energy intelligence needed to optimize today’s facility operations, electric submeters continue to provide a cost-effective way to help identify literally thousands of dollars in previously hidden energy savings opportunities.
Submeters can reveal operational inefficiencies, demand spikes and other bottom-line impacting events, while increasing facility operational effectiveness. As metering devices with monitoring capability that are installed on the facility side of the master meter (Figure 1), submeters provide any or all of the following:
- Usage analysis and peak demand identification
- Time-of-use metering of electricity, gas, water, steam, BTUs and other energy sources
- Cost allocation for tenant billing
- Measurement, verification, and benchmarking for energy initiatives like BOMA BESt (BOMA Canada’s Green Globes-based commercial building certification program), LEED energy and water efficiency credits, and others.
- Load comparisons
- Threshold alarming and notification;
- Multi-site load aggregation and real-time historical monitoring of energy consumption patterns for negotiating lower energy rates, and more.
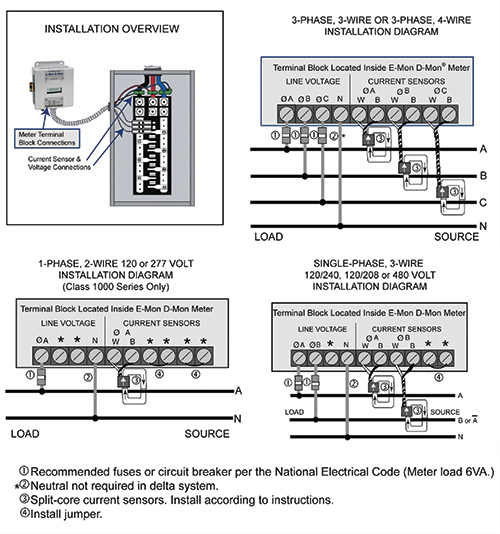
Figure 1. Submeters are used to measure energy consumption from the enterprise level all the way down to a single
device or circuit panel, as shown above. Sold through distribution, electric submeters are easily integrated with
water, gas and other pulse-output utility meters, energy intelligence software and Building Management
Systems (BMS), to provide a total facility energy snapshot.
Of the three main submeter types shown in Table 1, the first two – feed-through and current transformer (CT)-based – are socket-type meters. CT-style socket meters are used with loads of 400A and above. However, socket-type meters are not UL listed, a disadvantage in many jurisdictions. The third type is the solid-state electronic submeter, a non-socket device that provides clear advantages over the previous two.
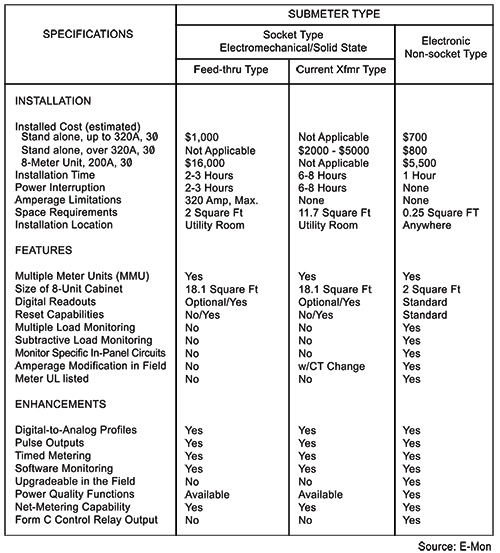
Table 1. Non-socket-type electronic submeters are less expensive initially, quicker and easier to install and offer
superior performance and options compared to other types, making them a cost-effective means
for measuring and verifying facility energy retrofit program goals.
Submetering Applications Overview
Submeters are useful for a number of energy monitoring needs, including but not limited to:
Aggregation – commercial property management companies, large multi-site industrial facilities, school districts and other mutual interest groups based on volume energy use are likely candidates for aggregating their combined energy consumption in deregulated jurisdictions. Submeters provide the advanced profiling needed for aggregating energy purchases.
Billing – revenue-grade-accuracy submeters provide the raw data needed by property managers to provide complete, accurate accounts of submetered tenant spaces, common areas and other metered entities (Figure 2). Energy intelligence software seamlessly converts the raw data into user-defined billing statements that provide all the necessary detail to eliminate tenant disputes through fair and accurate billing of actual consumption.
Cost Allocation – individually metering common areas provides the data needed to recover and allocate costs to event sponsors, tenants, departments or other budgetary entities. In the manufacturing setting, monitoring energy use of production, as well as non-production departments, allows businesses to drill down to find how, when and where energy is being used. In the educational setting, metering each department lets users take advantage of energy-saving opportunities which may be as simple as turning off lights or computers when rooms are not in use. Monitoring energy usage by individual department allows the tenant to allocate energy costs to specific departments within their own business, ensuring accurate budgeting and increased energy efficiency.
Demand Side Management – designed to reduce electrical demand and/or use, DSM strategies include load management, load profiling and load shedding to shift usage and demand to off-peak periods.
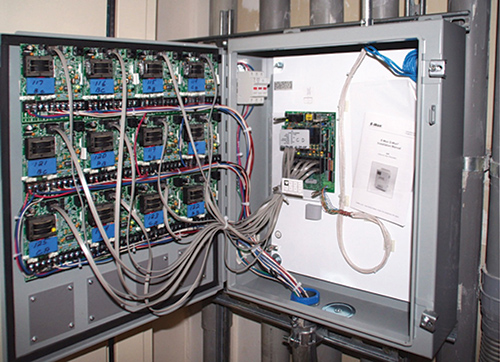
Figure 2. Installable in any convenient location, electric submeters are commercially available in a variety
of configurations from single, stand-alone devices to multiple-meter units (shown) housing up to two dozen
meters. Applications include benchmarking, measuring and verifying energy conservation and ROI goals
in connection with existing building retrofit initiatives gaining momentum around the country.
The key to avoiding higher charges is to identify usage peaks and take steps to reduce them. Submeters can be used to profile individual or aggregated loads to pinpoint peak usage areas or equipment that is performing outside normal limits. This allows manufacturers to employ load controlling devices to set high/low thresholds, control loads and reduce energy costs. Large commercial and industrial users that purchase power by the hour using either forecast or time-of-use (TOU) pricing will find TOU-capable meters and interval data recorders (IDR) useful for profiling demand and consumption at user-specified time intervals.
Energy Analysis and Load Control – plant operators require accurate, real-time status feedback to evaluate the performance of pumps, compressors, heaters, chillers, conveyors and other electrically powered equipment. However, many commercial and industrial customers do not have the resources to manage a full-scale load-management system. Advanced electronic submeters provide this capability via selectable high/low setpoints. The ‘high’ set point allows users to shave electrical demand peaks by activating a local generator or shedding loads to off-peak hours when energy is cheaper. The ‘low’ kW limit allows the load to be returned to normal operating power as pre-set parameters are met. A programmable timing feature allows delayed activation to eliminate ‘nuisances’ like short-term motor starts. Other functions are designed to prevent short-time cycling, as can occur in HVAC compressor control applications.
Measurement & Verification (M&V) – individual submeters can be installed at the point of load to monitor chillers, HVAC, air handlers, pumps and so forth. Operational inefficiencies may thus be identified to reveal, for example, if two or more large loads are coming on at the same time, causing demand spikes. Diagnostic functions also include the ability to identify equipment that may be close to failure, as indicated by a larger than normal current draw with no corresponding productivity output. Early identification of a potential problem allows facility engineers to schedule preventative maintenance before a costly failure occurs.
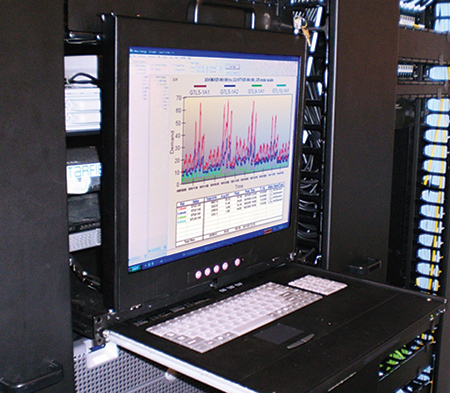
Figure 3. Energy intelligence software allows generation of graphs and profiles of kWh and kW for
demand analysis and usage reduction. Converted meter data is presented in both historical and
real-time slices for trending and reporting.
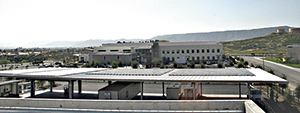
Wildomar, California, is the site of the first of ten new high-performance customer service centers that Southern California Edison (SCE) will be building over the next few years. Electric submeters are an integral part of the Wildomar facility’s energy monitoring system that tracks consumption (kWh) and demand (kW), a key performance requirement for obtaining Leadership in Energy and Environmental Design (LEED) certification.
With two multi-level main buildings and a single-story structure in the service yard, the 97,553-square-foot, $38M facility is almost 40 percent more energy efficient than similar buildings. Featuring solar panels (Figures 1 & 3) and energy-efficient lighting that automatically adjusts lumen levels to augment available natural lighting during daylight hours, these and other energy-efficiency features and water conservation measures helped the facility qualify for certification at the Gold level under the U.S. Green Building Council’s LEED high-performance building assessment system.
Sunwest Electric
Figure 1. Photovoltaic panels installed on the canopy over the utility serviceyard convert solar energy to electricity for the fuel dock, overhead lights and other circuits, earning a LEED credit for onsite renewable power.
The energy data acquisition front end of the Wildomar center’s building automation system (BAS) is provided by electric submeters from Langhorne, PA-based E-Mon, an energy monitoring hardware and software solutions provider. Sunwest Electric (www.sunwestelectric.net) of Anaheim, CA, the submetering system installer at Wildomar, specified 277/480V 3-phase/4-wire E-Mon D-Mon meters to monitor electrical consumption (kWh) and demand (kW) on two 200A and one each 1600A and 3200A circuits (Figure 2) in the three main buildings and the main switch board.
Communicating the raw energy data every 15 minutes to the energy manager’s PC via the facility’s Ethernet local area network, “the E-Mon D-Mons were installed to see how much power is being consumed in each building and to compare this usage to similar non-green buildings,” said Sunwest Project Foreman John Richards. “Benchmarking the energy-efficiency measures that were implemented in this facility will serve as a prototype for other service centers in the near future.”
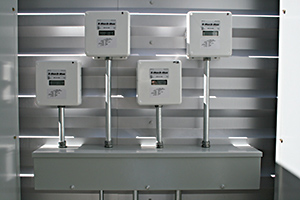
Figure 2. Four 277/480V submeters were installed next to a main switchgear cabinet outside one of the buildings.
From an operations standpoint, “Our new service center in Wildomar is a model of energy efficiency, environmentally friendly and vital to providing optimum service to our customers in southern Riverside County,” said Cecil House, SCE senior vice president, safety, operations support and chief procurement officer.
Sunwest Electric
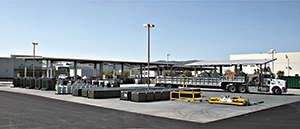
Figure 3. A ground-level view of the yard at SCE’s Wildomar, CA service center showing the photovoltaic panels and overhead lights monitored by electric ubmeters.
Energy Intelligence Software
Energy monitoring software allows users to read and monitor energy consumption and demand via on-site or remote, non-dedicated computer. Software allows generation of graphs and profiles of kWh and kW for demand analysis and usage reduction (Figure 3). Itemized bills may also be generated for tenant and/or department allocation and usage verification. Other key characteristics include:
- Remote or on-site meter communications via modem, Ethernet, Internet and wireless
- Reads multiple time periods for time-of-use (TOU) monitoring
- Operates on Windows 2000, XP or Vista operating systems
- Exportable, user-configurable data to spreadsheets, MV-90, etc.
Integrating Meters with the BMS
Submeter communications are typically achieved through (1) proprietary energy analysis software and protocols or (2) via pulse output into an energy management system. In both cases, the software resides on the user’s PC and communications are accomplished through a “hard-wired” system or a phone modem.
Hard-wired systems work through dedicated RS-485 cabling or through an Ethernet connection that uses an existing network. Ethernet communications do require an optional module and an Internet Protocol (IP) address. Using the RS-485 approach allows up to 4,000 feet of cabling to be run in the building. Available software is able to either method simultaneously and is easily set up to do this. One important thing to remember is that pulse-output electric, water, gas, steam and other similar meter types have to be used with an IDR (Interval Data Recorder) to provide communications.
Unlike meters which continuously read energy usage as it occurs, IDRs collect and store consumption (kWh) and demand (kW) meter information at user-specified time periods from five to 60 minutes, allowing for profiling of energy data and more detailed comparative analysis for billing and other uses. Stored IDR data can be accessed via telephone modem, Ethernet, ModBus, BACnet, Internet Protocol (IP), LonWorks TP or MV-90. Data can be used to interface with Automatic Meter Reading (AMR) and billing software, Building Management Systems or other energy software.
Ethernet – may be used with both intranet and Internet systems. When tied to the Internet, for example, meters anywhere in the world can be read without bearing long distance charges, as would be the case using a telephone modem. Moreover, Internet access time is very quick, which is especially valuable if ‘real-time’ access to the meter data is desired.
Modbus – data is exported from the meter on request and the automation or control system processes the raw data for its use. If the IDR is used through Modbus, the data is typically limited to kWh (consumption) and kW (demand). Modbus-compatible meters usually come in the form of (1) Modbus RTU which communicates through RS-485 cabling, and (2) Modbus TCP which is used when Ethernet is the form of communication required by the user.
BACnet – as with Modbus, BACnet-compatible meters communicate over an RS-485 cable system or utilize Ethernet cabling. When used with RS-485, the BACnet MS/TP protocol is utilized. When Ethernet is the choice of communication, BACnet IP is the protocol.
LonWorks – open-protocol LonWorks has its own specialized form of communication and uses neither RS-485 nor Ethernet cabling. Lon TP (twisted pair) is used with this meter and communicates over a twisted-pair of wires, making it somewhat unique in its application and installation.
Energy Data Presentment
Submeters are useful for a number of energy monitoring needs. By importing data from electric submeters and other metering devices into Web-based communications, interval data may be cost-effectively collected, analyzed and displayed in near real-time (Figure 4) to:
- View resource use in hourly, daily, weekly, monthly or yearly increments
- Compare historical data with current consumption patterns
- Translate savings into monetary results
- Visualize what sustainable efforts are in place
- Show how being efficient saves money, tax dollars and helps the environment
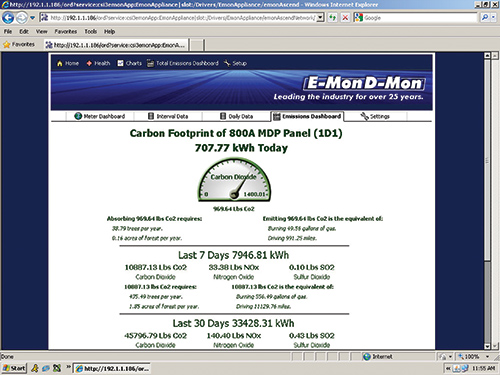
Figure 4. Carbon footprint dashboard of an 800A main distribution panel. The meter data provided by an E-Mon
D-Mon Class 3000 submeter is converted by energy intelligence software into real-time and historical kWh statistics,
along with generated CO2, NOx, SO2 and other measurements and calculations.
Bottom Line Considerations
As first-level energy data acquisition tools, electric submeters – in conjunction with automatic meter reading (AMR) software solutions, web-enabled meter dashboards and other energy monitoring and management solutions – can help facility operators to measure, verify and report compliance with whatever requirements they may encounter. The old energy adage – ‘you can’t manage what you don’t measure’ and its implied corollary ‘you can’t save what you don’t manage’ – was never more valid than in today’s increasingly energy-minded facility environment. To that end, submeters offer the using facility an accurate, cost-effective tool for doing exactly that, while providing the flexibility and scalability to respond to evolving operational requirements.
About the Author
 David Bovankovich, Vice President of Engineering for E-Mon, has more than 30 years of electrical engineering, facility management, design, and metering expertise. As a utility industry liaison, Bovankovich participated in the U.S. Energy Association’s Energy Efficiency Forum and was a member of the Publisher’s Roundtable for NEC Digest. He has participated in deregulation hearings of both California and Pennsylvania. Dave can be contacted at dbovancovich@emon.com