
A rapidly increasing availability of energy at reasonable prices is one of the key issues for the development and interest in renewable energy. The deterioration of local and global environmental conditions and increasing recognition of the threats posed by greenhouse effects have become the driving force towards the development of energy alternatives and improvements in the efficiency of energy use. There is currently a paradigm shift towards the use of Renewable Energy Sources (RES) even with the knowledge that grid instability can increase with renewable energy grid integration. Thus, the integration of energy generated from renewable sources into the electricity grid can pose significant challenges for both the grid manager and the producer. When the percentage of energy generated from renewable sources becomes significant, such as for a local utility, the energy operator may find that issues will arise with regard to the grid stability and the quality of distributed energy in terms of voltage sag and frequency fluttering.
For the RE (Renewable Energy) producer, given the relative youth of the market, and often the lack of industrial proficiency in automation and instrumentation strategies, it is difficult to implement a proper method of monitoring and control, which is crucial for efficient operation of the plant. An automation based management system relieves the human operator from routine processes by interfacing with a computer, thus resulting in a man-machine interface system.
Can an AMS help?
Usually an AMS is that system (or subsystems that come together to produce the result), which validates and supports plant operations, offering support for daily management and troubleshooting of problems. In some robust cases, an AMS also provides support for all the business processes that trigger the onset of an anomaly. In other cases, AMS is mainly intended to support the ‘long-term health’ of the plant and is less versatile regarding a continuous tune-up of plant productivity.
However, if we look at the particular business of electricity generation from renewable here, the technical and sales sides are coordinated and synchronized in a continuous process that can’t be separated (at least for the moment).
This condition is not different from those of prepaid telecommunications services where downtime or quality of service turns into a quantifiable loss of revenues.
Since a significant part of the theoretical elaboration about AMS takes place on telco standardization bodies, it will be appropriate to refer to this scenario in order to better frame the subject.
According to TM Forum Business Process Framework definitions, we have a pretty broad set of functionalities under the umbrella of Performance Management Program. Most of those are related to accounting, billing and collection of revenues, and in general are off-line activities. However, if you look under the Assurance vein, you will find some concepts as we look for: Service Quality Management and related Resource Performance Management.
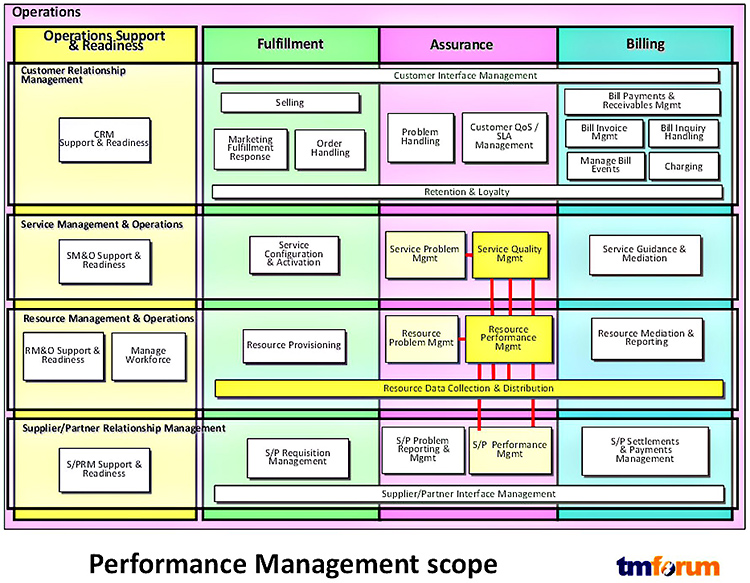
Fig 1: TM Forum Performance Management Program
These kinds of applications emerged some years ago as Performance Monitoring and have already found some diffusion in the market of renewable energy.
After examining AMS in the industrial standard perspective, we need to take a look at an actual Photovoltaic (PV) Performance Monitoring system.
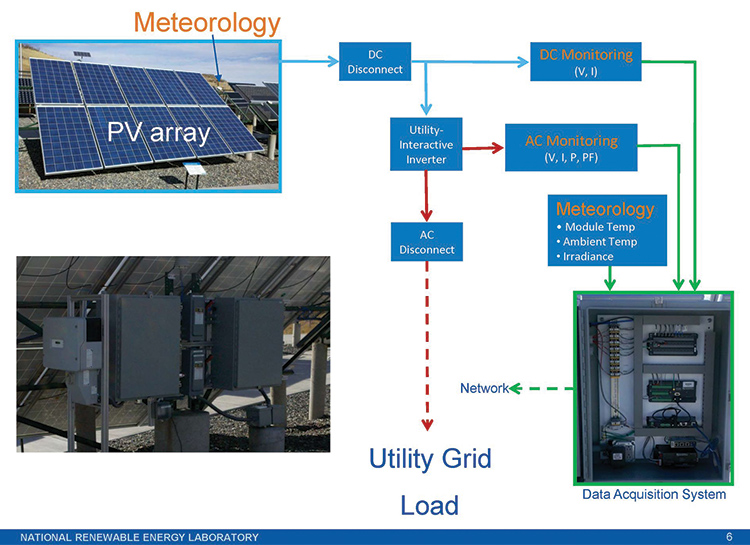
Fig 2: A PV system monitoring and with the essential components (courtesy of NREL)
This is conceptually a pretty simple application, performing a real-time continuous comparison of the actual production. We will need a rather dynamic and specific benchmark of the plant production capabilities – something capable of estimating exactly how much energy the plant under healthy conditions would produce in the actual weather conditions. As a technical synopsis, we will use a mathematical model and a data set in order to supply variables for the simulation.
Both European and US standardization bodies and research organizations have expressed regulations and recommendations that represent an excellent starting point regarding our investigation into PV Monitoring systems.
In particular in the U.S., NREL (National Renewable Energy Laboratory) (see Fig 3) publishes a summary of such as ranges from the suggestion of optimal intervals of sampling data to the recommendations of installation and type of electrical and weather sensors.
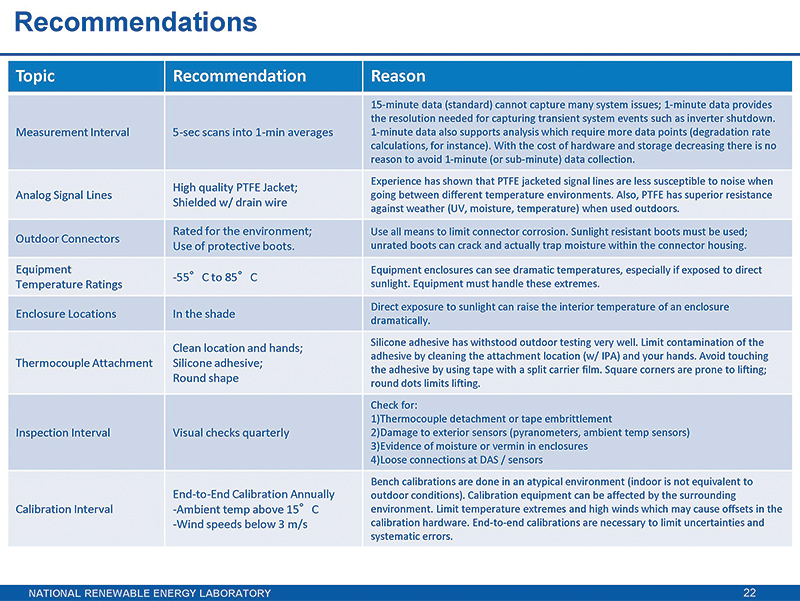
Fig 3: ‘Monitoring System Performance’ (NREL/PR-5200-50643)
Scrolling recommendations show that measures to support a system of PV Monitoring are rather critical, involved technologies and are not elementary. In general the design of an accurate PV Monitoring system is not a simple topic as will be more apparent hereafter.
PV Monitoring System Design
At Staer Sistemi, we approached the matter in late 2009 trying to invest decades of experience in AMS for client companies. ‘Keep it simple’ was our slogan but unfortunately that wasn’t easily fitting the application.
We, in fact, started design from the DAS (Data Acquisition Systems) block (see Fig. 2) to discover that, according to published research papers,1 the volatility of solar radiation at ground level mainly due to atmospheric turbulence was asking for a pretty fast sampling pace (5 second or less). That meant we would need our DAS to process a data stream in the range of several thousand measures per second (in Europe and especially in Italy 1 MWp (megawatt peak) plants were the average size and our customers were planning up to 5 MWp). After some design tests using standard web application frameworks we weren’t able to reach an acceptable quality standard. At the same time the client’s internal large caliber software system was out of the scope. We adopted an industrial, yet modern, low-weight SCADA (supervisory control and data acquisition) software package – PcVue 10.0 from Arc Informatique. From that point on, we found that it made the design process easier to manage and the development of our EMSS (energy management support system) straightforward.
Modeling a complete plant
A complete PV plant consists of chained subsystems:
- the photovoltaic generator (panels in series and parallel)
- inverters (which are distributed or centralized)
- transformers (in the case of installations connected in MT to the grid)
A model design allows each subsystem to be managed separately but also takes into account how the systems are operating together as one cohesive entity. Many mathematical methodologies are available related to the physical reality of devices. Usually we discern using physical or empirical techniques (the latter comprising heuristic or statistical approaches). Hybrid methodologies can also be applied.
PV generator modeling
At Staer Sistemi, we opted for a hybrid approach based on physical modeling and some empirical functions. Those were helping to take into account the variance of solar spectrum during the day and the angle of incidence of the radiation on the panels’ surface as well as accurately modeling separate contributions of the direct and diffuse radiation – that was important to accommodate various operating conditions and PV technologies such as Amorphous Silicon (aSi) and other thin film types.
Such an investment of R&D resources was necessary as each component of PV generator (single panels and strings of panels) contributes marginally to the global production. Simulation of energy production must be very accurate to allow discrimination of any malfunctions of individual panels inside strings.
The model for Cristalline Silicon (cSi), which was developed at the University of Rome Tor Vergata, showed remarkable accuracy. Since any specific measure on the panel’s electrical figures (data supplied by the manufacturers) were economically sustainable. This allowed the application of a novel numerical technique of retro-tuning of model parameters, developed to manage inaccuracies of panel data sheets.
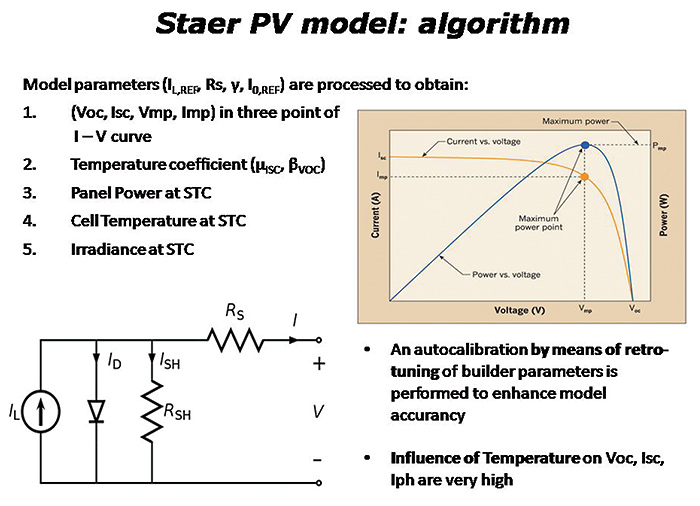
Fig 4: Staer Sistemi PV generator hybrid model
Modeling inverter
The inverter has adopted an empirical model that reproduces the operating characteristic curves supplied by the manufacturer through a simple input-output matrix. Alternatively, in addition to or to correct the manufacturer information, the model can use data derived from tests performed by specialized magazines (i.e. Photon International) or credited third party labs. That simple approach was capable of detecting the lack of efficiency or defects in MPPT (maximum power point tracking) functionality of inverters and allowed an accurate picture of true inverter capabilities in marginal conditions despite manufacturers’ data claims.
Modeling transformer
The system finally implements a physical model of the transformer starting again from the data provided by the manufacturer. Losses, such as temperature of the package windings (detected through the appropriate sensor), are taken into account. Core eddy currents and related phenomena were also found to impact efficiency.
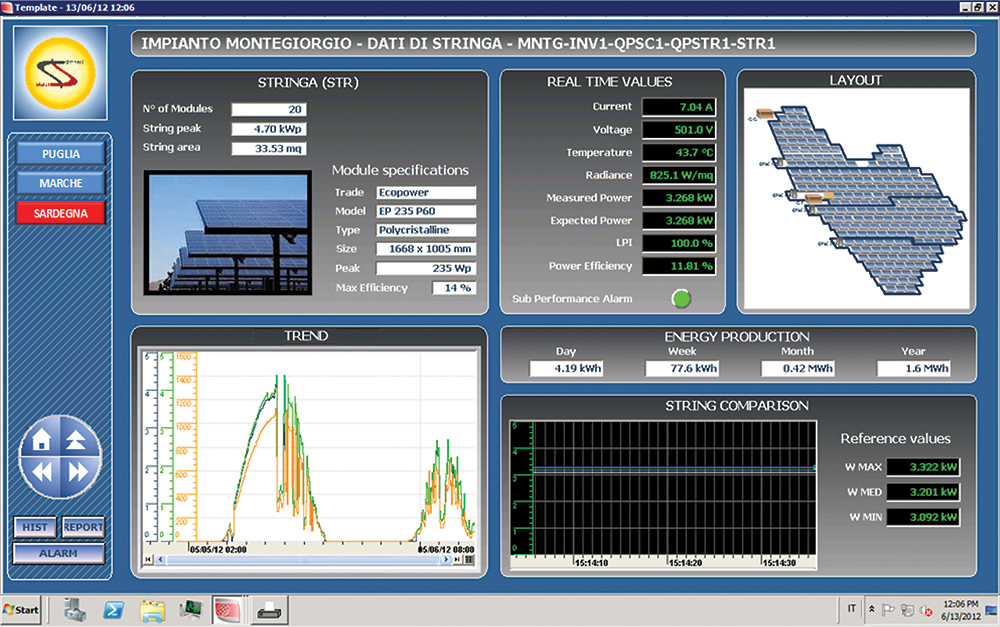
Fig 5: Analysis of weather-related changes on performance
Comparison and Performance Indexes
The availability of a model for each subsystem and the availability of Meteorology data and Input/Output Electrical Measures for each block (PV panels where the energy input is solar radiation) enable the system to draw a comparison between the actual performance and the elaborations of the models. The results are delivered through the adoption of a simple metric. This is actually the ratio (a 1 minute average of 5 sec samples) between the measured power and what the model has computed. We called that Local Performance Index or LPI. This ratio is very close to the instantaneous power conversion efficiency of each subsystem.
Accordingly, Performance Index (PI) represents the overall performance of the system and is calculated as the ratio between the energy sold to the grid (at utility meter) and input in DC power. The model of PV generator is calibrated correctly for the instantaneous weather conditions. PI is also the product of all LPIs.
Back to AMS
The Performance Monitor Module PMM of EMSS generates alerts that are filtered and treated much like any other system alarms and managed according to the classic functionality of any AMS. In fact, according to the degree of severity set up, the underperformance event can trigger alarms at the local or remote management stations by sending short message service (SMS) or e-mail, which will open Trouble Tickets, alert Workforce Management applications, and so on.

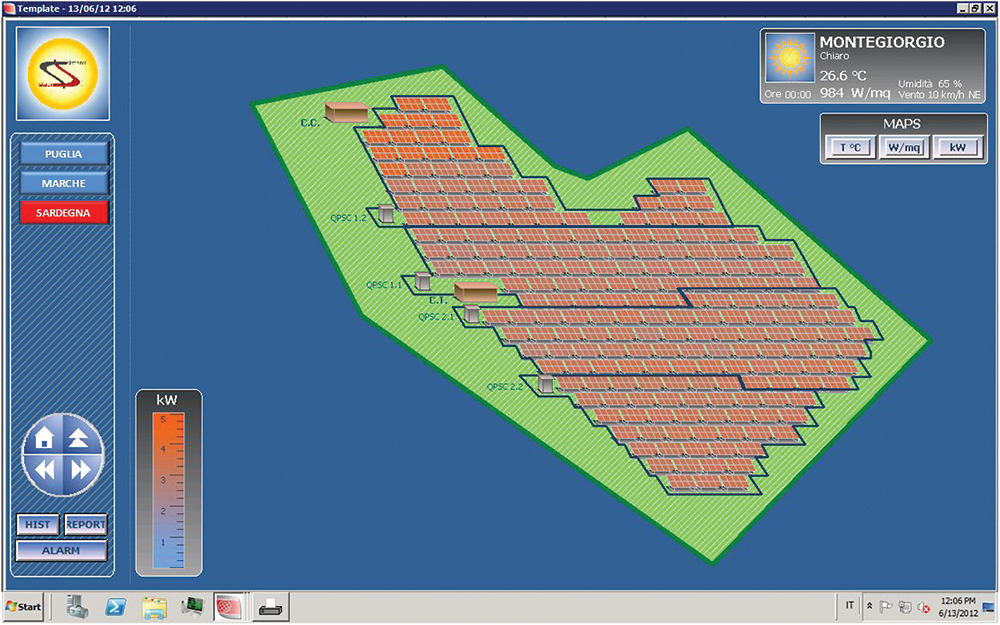
Fig 6: PcVue-based GUI’s
The future is now
In the opening we mentioned the problems that are associated with distributed renewable generation and that are common with other intermittent source or load scenarios that affect electric grid management.
What emerged in Europe and in the U.S., after a wide debate on a possible approach to the problem or even a temporary solution, was the introduction for producers of some incentives mechanisms (or even penalization policies) concerning production forecasting.
In this regard EMSS comprises a module of Production Forecasting that, when appropriately supplied with weather data can offer very accurate prediction in the 24 to 72 hour range. There are many organizations that can provide an accurate forecast in the format required by the system.
The functionality has been developed building upon the already described PMM. In practice that software module is fueled with the weather forecast data based on irradiation, temperature, and wind speed (this latter to calculate the PV cell temperature in the absence of back panel thermal sensor readings). The granularity of forecast data can be numerically pushed up to the minute matching real data. Every aspect is in fact conceptually the same as true production conditions.
Forecasted PV generator production (if no relevant problems limiting production are logged) is in general calculated with the LPI of the previous day to take in account the actual ‘health’ condition. The process is repeated along plant subsystem chains.
Just in the case of electricity production that is only partially sold to the grid, the production forecast obtained would need to be corrected along with the local consumption forecast.
An additional revenues venue
According to the Federal Energy Regulatory Commission, Demand Response (DR) programs are intended to stimulate some planning in the electric usage by end-use customers from their normal consumption patterns in response to changes in the price of electricity over time. DR incentive payments are designed to induce lower electricity use at times of high wholesale market prices or when system reliability is jeopardized. Lower electricity use does not exclude local production being a more general concept.
In our case of interest, DR initiatives and electric utilities are offering a sort of partnership whereby the economic equivalent of the costs a utility should sustain, for energy production in particular conditions, end up being fully paid to the PV (or other renewables) producer (or common customer most of the time) for their capabilities to schedule the amount of their consumption, production, or both, in a precisely planned way.
In practice, the DR incentives can be particularly advantageous during periods of maximum stress to the power grid – usually central hours of summer days. This period is coincident with the maximum production capacity of PV systems. The eligibility of DR programs for production from renewable sources may have some restrictions.
Conclusion
For the RE producer, the availability of a sophisticated AMS based on industrial grade SCADA software, such as PcVue, that is capable of effectively tracking the production performance, can help to increase the plant’s bottom-line. In many cases this has been proved to be greater than ten percent annually.
The opportunity to enroll in increasingly popular DR programs through the Product Forecasting with Staer Systemi EMSS, can qualify PV energy producers with additional income.
About the Author
 Lino Picheo is President of Staer Sistemi, a SCADA solutions systems integrator based in Italy. The company has expertise in renewable energy, oil & gas, transportation, and water industries. Lino has worked for CPG (Consultancy & Project Group), Smarten Software, and Sun Microsystems.
1 V. Badescu (Ed.) Modeling Solar Radiation at the Earth’s Surface Recent Advances 4y Springer